Fig. 8
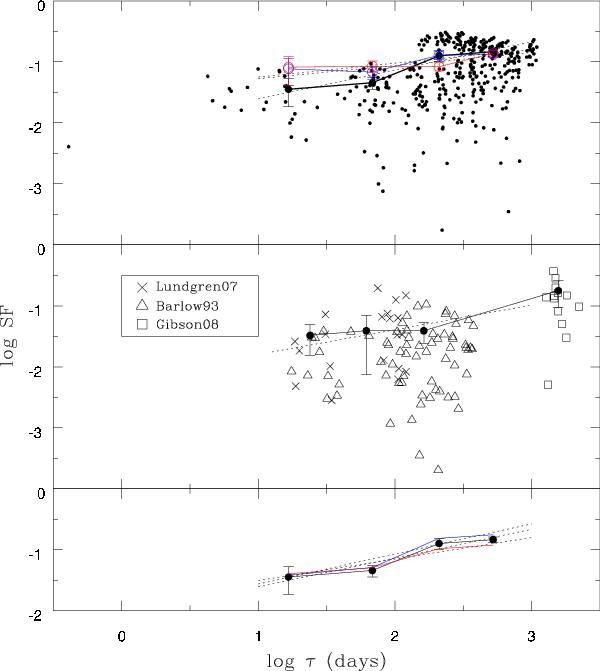
Top panel: structure function of APM 08279+5255; small dots represent the UDSF points (Eq. (6)) relative to BAL variations; filled circles connected with continuous line represent the corresponding binned SF; blue and red open circles connected by continuous lines represent the binned SF for blue and red NALs (blue and red, respectively). The relevant fitting relations corresponding to Table 2 are shown as dotted lines. Middle panel: ensemble structure function based on data from the literature (Barlow 1993; Lundgren et al. 2007; Gibson et al. 2008); UDSFs with different symbols as specified in the inset; filled circles connected by continuous line represent the binned ensemble SF and dotted line shows the best fit relation of Table 2. Bottom panel: structure functions of the two BAL components of APM 08279+5255; BAL1 blue line, BAL2 red line, for comparison black filled circles and the connecting line show the structure function of the total WBAL as in the top panel.
Current usage metrics show cumulative count of Article Views (full-text article views including HTML views, PDF and ePub downloads, according to the available data) and Abstracts Views on Vision4Press platform.
Data correspond to usage on the plateform after 2015. The current usage metrics is available 48-96 hours after online publication and is updated daily on week days.
Initial download of the metrics may take a while.