Fig. 8
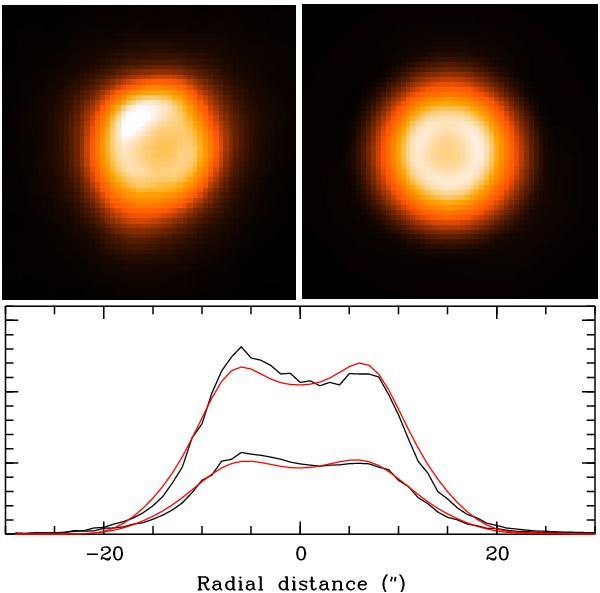
Top left: the 1′ × 1′ image of the nebula around WRAY 15-751 observed with PACS at 70 μm. North is up and east to the left. Top right: the synthetic image computed with 2-Dust using rin = 7″ and rout = 21″ and convolved with the PACS PSF. Bottom: East-west cuts through the central part of the nebula, observed (black) and synthetic (red). The upper plots correspond to the 70 μm image, the lower ones to the 100 μm image.
Current usage metrics show cumulative count of Article Views (full-text article views including HTML views, PDF and ePub downloads, according to the available data) and Abstracts Views on Vision4Press platform.
Data correspond to usage on the plateform after 2015. The current usage metrics is available 48-96 hours after online publication and is updated daily on week days.
Initial download of the metrics may take a while.