Fig. 7
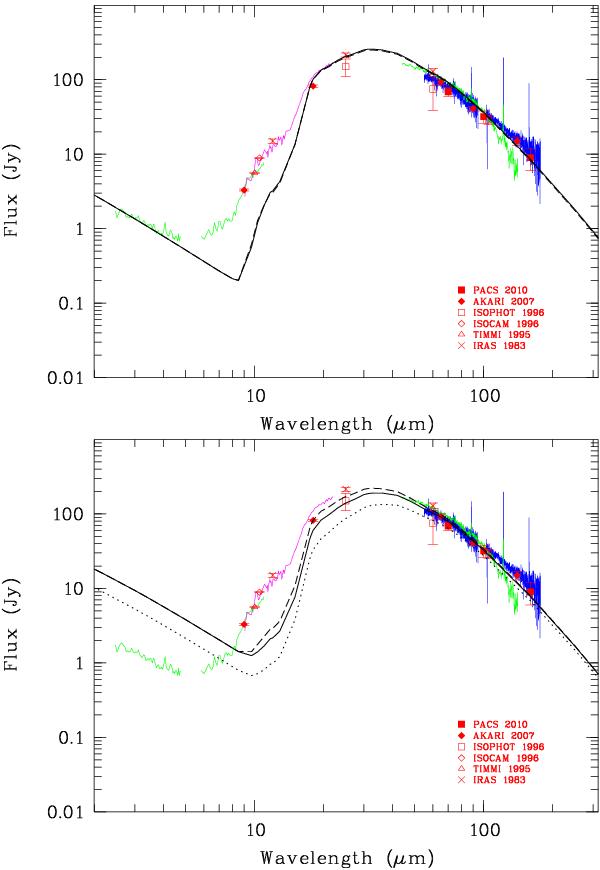
Infrared spectrum of WRAY 15-751 from data collected at different epochs: IRAS LRS from 8 to 22 μm (1983, magenta), ISOPHOT from 2.5 to 11 μm and ISO LWS from 45 to 140 μm (1996, green), Herschel-PACS from 55 to 180 μm (2010, blue). The ISOPHOT data at λ < 5 μm are corrected for extinction using E(B − V) = 1.8. At λ > 100 μm, the flux density from ISO LWS is not reliable, the LWS aperture is too small for the ISO PSF. Color-corrected photometric measurements are superimposed (red symbols). The spectrum at λ < 5 μm comes from the central star, the bump at ~10 μm from silicates and very small out-of-equilibrium dust grains, and the spectrum at λ > 20 μm from the bulk of the dust shell. Results of the 2-Dust model fitting are illustrated. Top: best fits of the IRAS/ISO data assuming R⋆/Teff = 80/18 000, amin/amax = 0.05/1.5 (solid line) and amin/amax = 0.2/0.5 (dashed line). Bottom: fits of the AKARI/Herschel data using the same dust shell properties but with R⋆/Teff = 320/9000. Results for a lower-luminosity star R⋆/Teff = 240/9000 and amin/amax = 0.2/0.5 are also displayed (dotted line).
Current usage metrics show cumulative count of Article Views (full-text article views including HTML views, PDF and ePub downloads, according to the available data) and Abstracts Views on Vision4Press platform.
Data correspond to usage on the plateform after 2015. The current usage metrics is available 48-96 hours after online publication and is updated daily on week days.
Initial download of the metrics may take a while.