Fig. 6
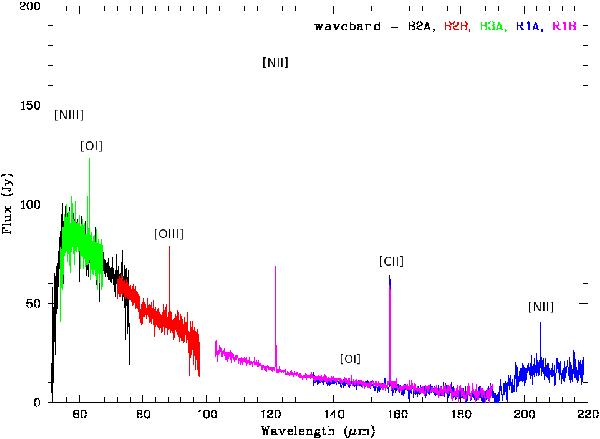
PACS spectrum of WRAY 15-751, integrated over the nine central spaxels. Indicated are the lines [Niii], [Oi], [Oiii], [Nii] and [Cii]. The continuum shape below 55 μm results from a yet-imperfect spectral response function correction, while above 190 μm it results from a light leak, from the second diffraction order of the grating in the first one. The different bands are indicated with different colors.
Current usage metrics show cumulative count of Article Views (full-text article views including HTML views, PDF and ePub downloads, according to the available data) and Abstracts Views on Vision4Press platform.
Data correspond to usage on the plateform after 2015. The current usage metrics is available 48-96 hours after online publication and is updated daily on week days.
Initial download of the metrics may take a while.