Fig. 5
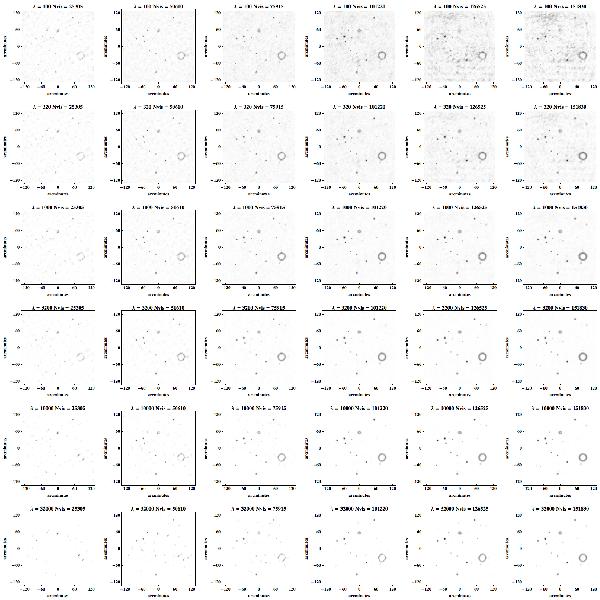
Reconstructed images from visibilities calculated from the test image in Fig. 3. From left to right, the number of visibilities increases from 25 305 to 151 830. From top to bottom, λ takes the values 100, 320, 1000, 3200, 10 000, and 32 000. Note that these images are the final result of the FISTA algorithm − they have not been convolved with the synthesised beam of the telescope, and no residuals have been added.
Current usage metrics show cumulative count of Article Views (full-text article views including HTML views, PDF and ePub downloads, according to the available data) and Abstracts Views on Vision4Press platform.
Data correspond to usage on the plateform after 2015. The current usage metrics is available 48-96 hours after online publication and is updated daily on week days.
Initial download of the metrics may take a while.