Fig. 4
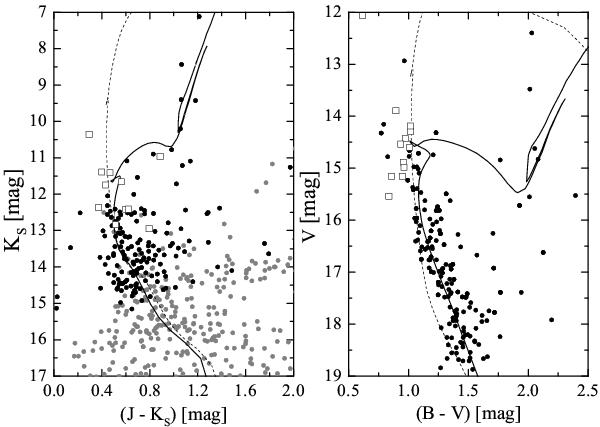
Colour–magnitude diagrams for Ruprecht 130. Black dots in the NIR CMD represent the stars observed in the visual by Piatti et al. (2000). Grey dots are additional 2MASS/UKIDSS objects within a 2′ radius. Open squares indicate the position of stars near the blue hook and probable blue stragglers, which are noticeable in the visual, with available good quality NIR data. The solid lines show the isochrones for our results (560 Myr), and the dashed lines 50 Myr isochrones with the parameters listed by Piatti et al. (2000).
Current usage metrics show cumulative count of Article Views (full-text article views including HTML views, PDF and ePub downloads, according to the available data) and Abstracts Views on Vision4Press platform.
Data correspond to usage on the plateform after 2015. The current usage metrics is available 48-96 hours after online publication and is updated daily on week days.
Initial download of the metrics may take a while.