Fig. 5
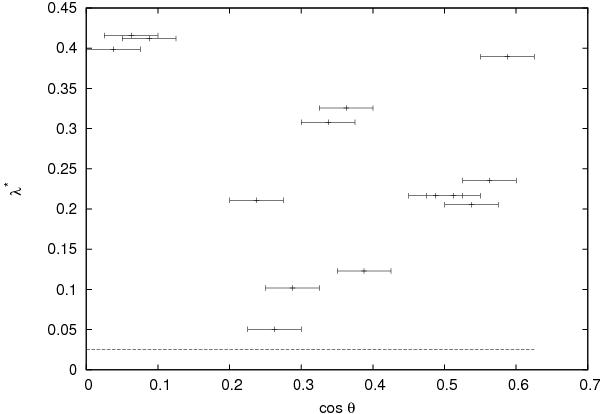
Results of Student test comparing results obtained with the VLT by Srianand (2013, priv. comm.) (group III) with results obtained with the same telescope by King et al. (2012) (group II). Data sets are selected according to angular position; λ ∗ is the calculated level of the test for each interval (the dotted line indicates the λ ∗ ≤ 0.025 rejection region).
Current usage metrics show cumulative count of Article Views (full-text article views including HTML views, PDF and ePub downloads, according to the available data) and Abstracts Views on Vision4Press platform.
Data correspond to usage on the plateform after 2015. The current usage metrics is available 48-96 hours after online publication and is updated daily on week days.
Initial download of the metrics may take a while.