Fig. 7
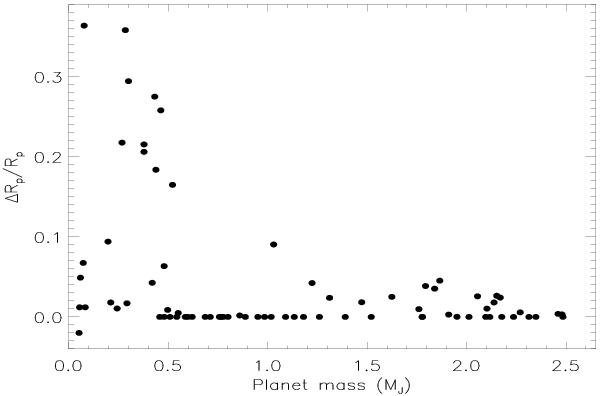
Relative variation of the radius corresponding to optical depth τ = 1 in the centre of the Lyman-α line for normal incidence across the planetary atmosphere vs. the planet mass. The plotted case corresponds to the slowest decay of the stellar field with distance (s = 2.0) that provides an upper limit to the predicted variation.
Current usage metrics show cumulative count of Article Views (full-text article views including HTML views, PDF and ePub downloads, according to the available data) and Abstracts Views on Vision4Press platform.
Data correspond to usage on the plateform after 2015. The current usage metrics is available 48-96 hours after online publication and is updated daily on week days.
Initial download of the metrics may take a while.