Fig. 6

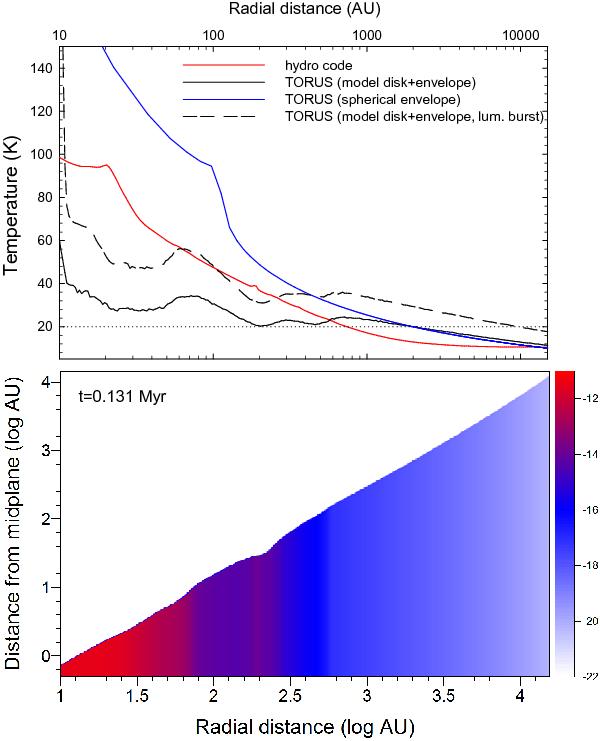
Top: gas radial temperature profiles. In particular, the red line presents the azimuthally averaged midplane temperature Tmp derived from hydrodynamical simulations at t = 0.131 Myr and the total stellar luminosity L∗ = 9 L⊙. The black solid line shows the gas temperature derived using the TORUS radiation transfer code, for the same gas density distribution and stellar luminosity as in the hydro model (case 1). The dashed solid line presents the TORUS calculation of the gas temperature for the same gas density distribution (case 1) but a higher stellar luminosity of 100 L⊙. Finally, the blue line shows the gas temperature calculated by the TORUS code for a spherically symmetric gas density distribution representing an infalling spherical envelope with the same mass as in the hydro model (case 2). Bottom: the gas volume density distribution used by the TORUS code (case 1) to calculate the gas temperatures (black solid and dashed lines). The scale bar is in g cm-3.
Current usage metrics show cumulative count of Article Views (full-text article views including HTML views, PDF and ePub downloads, according to the available data) and Abstracts Views on Vision4Press platform.
Data correspond to usage on the plateform after 2015. The current usage metrics is available 48-96 hours after online publication and is updated daily on week days.
Initial download of the metrics may take a while.


