Fig. 7
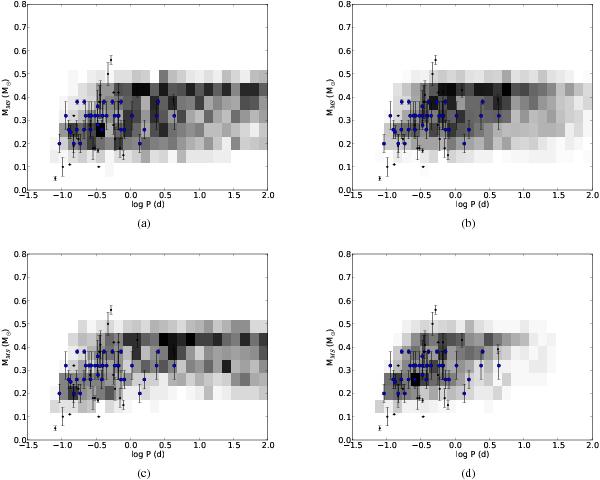
Visible population of PCEBs in the SDSS as a function of orbital period and mass of the MS star for all models: (a) model γα1, (b) model αα1, (c) model γα2, and (d) model αα2. The intensity of the grey scale corresponds to the density of objects on a linear scale. Overplotted are the observed PCEBs taken from Zorotovic et al. (2011a). Thick points represent systems that are found by the SDSS, and thin points represent previously known PCEBs with accurately measured parameters. The previously known sample of PCEBs is affected by other selection effects than the SDSS sample or the synthetic sample. Note that Ik Peg has been removed from the sample as its MS component is not an M-dwarf.
Current usage metrics show cumulative count of Article Views (full-text article views including HTML views, PDF and ePub downloads, according to the available data) and Abstracts Views on Vision4Press platform.
Data correspond to usage on the plateform after 2015. The current usage metrics is available 48-96 hours after online publication and is updated daily on week days.
Initial download of the metrics may take a while.