Fig. 6
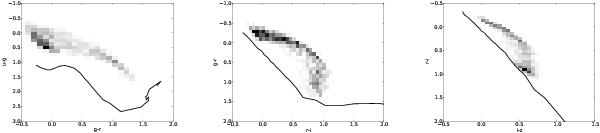
Color−color diagrams for the visible population of PCEBs in the SDSS for model αα2. On the left, it shows the u−g vs. g−r diagram, in the middle, the g−r vs. r−i diagram, and on the right, the r−i vs. i−z diagram. The intensity of the grey scale corresponds to the density of objects on a linear scale. The solid line corresponds to the unreddened MS from A-type to M-type MS stars. The color−color diagrams are very comparable to those of model αα1, model γα1, and model γα2.
Current usage metrics show cumulative count of Article Views (full-text article views including HTML views, PDF and ePub downloads, according to the available data) and Abstracts Views on Vision4Press platform.
Data correspond to usage on the plateform after 2015. The current usage metrics is available 48-96 hours after online publication and is updated daily on week days.
Initial download of the metrics may take a while.