Free Access
Fig. 4
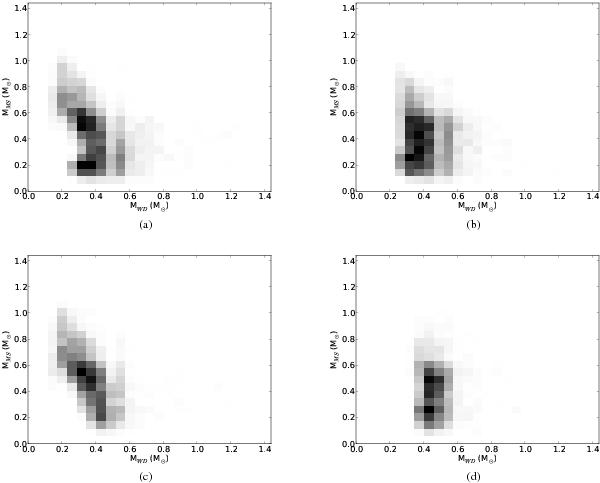
Visible population of PCEBs as a function of mass of the WD and the MS star for all models: (a) model γα1, (b) model αα1, (c) model γα2, and (d) model αα2. The intensity of the grey scale corresponds to the density of objects on a linear scale.
Current usage metrics show cumulative count of Article Views (full-text article views including HTML views, PDF and ePub downloads, according to the available data) and Abstracts Views on Vision4Press platform.
Data correspond to usage on the plateform after 2015. The current usage metrics is available 48-96 hours after online publication and is updated daily on week days.
Initial download of the metrics may take a while.