Free Access
Fig. 7
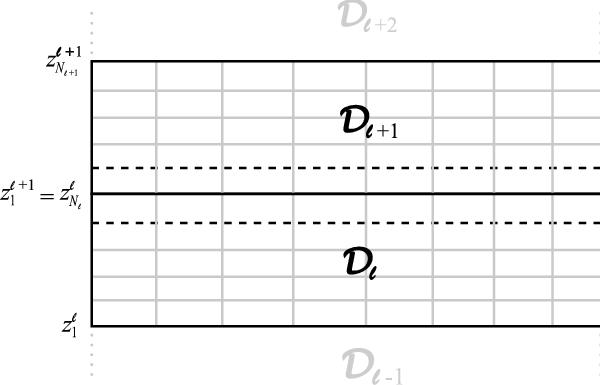
Domain decomposition in the z-axis, with Nℓ denoting the number of discrete heights within domain  . The solid line
  indicates the boundary layer of the domains
  and
and  , while the dashed lines indicate the ghost layers
  and
and  .
.
Current usage metrics show cumulative count of Article Views (full-text article views including HTML views, PDF and ePub downloads, according to the available data) and Abstracts Views on Vision4Press platform.
Data correspond to usage on the plateform after 2015. The current usage metrics is available 48-96 hours after online publication and is updated daily on week days.
Initial download of the metrics may take a while.