Fig. 2
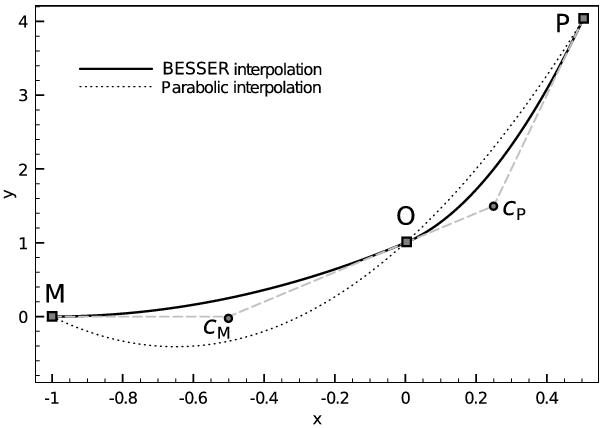
Parabolic and BESSER interpolation using the three successive points M, O, and P. Dotted line: parabolic interpolation may create a spurious extremum between points M and O. Solid line: interpolation using our BESSER method with continuous derivative at point O. The control points of the intervals, whose y-coordinates are denoted by cM and cP, define tangents to the Bézier splines in their endpoints. The x-coordinates of the control points are located at the center of the corresponding intervals.
Current usage metrics show cumulative count of Article Views (full-text article views including HTML views, PDF and ePub downloads, according to the available data) and Abstracts Views on Vision4Press platform.
Data correspond to usage on the plateform after 2015. The current usage metrics is available 48-96 hours after online publication and is updated daily on week days.
Initial download of the metrics may take a while.