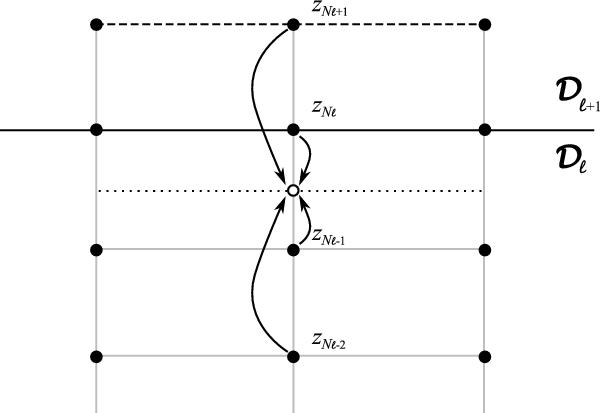
Fig. 14

Illustration of the prolongation of the coarse-grid correction to the fine grid using data from the ghost layer. Solid black line: the boundary layer between the domains  and
and  . Dashed line: the ghost layer of the domain
  . Dotted line and the empty circle: the fine-grid layer near to the domain boundary and a fine-grid node. Gray lines: lines of the coarse grid. The arrows show how the data are interpolated to the fine-grid node using the cubic-centered interpolation of the coarse-grid nodes data.
Current usage metrics show cumulative count of Article Views (full-text article views including HTML views, PDF and ePub downloads, according to the available data) and Abstracts Views on Vision4Press platform.
Data correspond to usage on the plateform after 2015. The current usage metrics is available 48-96 hours after online publication and is updated daily on week days.
Initial download of the metrics may take a while.


