Fig. 6
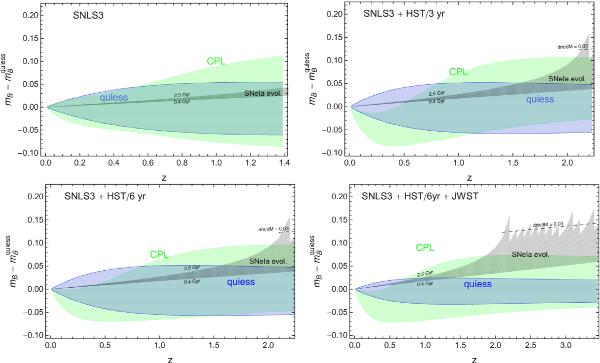
Future tests for SN Ia evolution. Blue contours show the 1σ confidence levels derived from errors on the equation of state parameter (w0) of quiessence models. Light green regions are the 1σ confidence levels derived from errors on w0 and wa of CPL models. Gray regions denote a plausible range for SN Ia evolution effects, following Dominguez et al. (2001) and Riess & Livio (2006) and assuming dmB/dMMS ~ 0.03.
Current usage metrics show cumulative count of Article Views (full-text article views including HTML views, PDF and ePub downloads, according to the available data) and Abstracts Views on Vision4Press platform.
Data correspond to usage on the plateform after 2015. The current usage metrics is available 48-96 hours after online publication and is updated daily on week days.
Initial download of the metrics may take a while.