Fig. 1
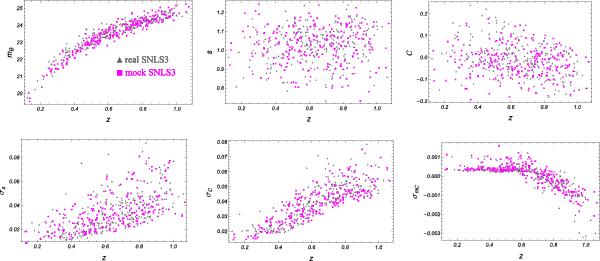
Comparing real and mock SNLS sub-sample from the SNLS3 data set: gray triangles are for real SNLS3 data, magenta squares for mock SNLS3 data. Top. From left to right: magnitude, stretch and color vs. redshift. Bottom. From left to right: diagonal stretch error, color error, and magnitude-color covariance vs. redshift.
Current usage metrics show cumulative count of Article Views (full-text article views including HTML views, PDF and ePub downloads, according to the available data) and Abstracts Views on Vision4Press platform.
Data correspond to usage on the plateform after 2015. The current usage metrics is available 48-96 hours after online publication and is updated daily on week days.
Initial download of the metrics may take a while.