Fig. 4
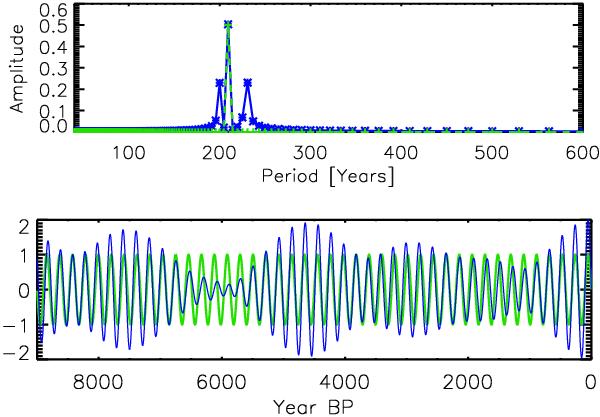
Power spectra (upper panel) and time series (lower panel) of a synthetic planetary forcing signal assumed to consist of a single sinusoidal mode with a period of 209.3 years (green lines) and a synthetic solar activity signal which has two additional peaks at 199.3 and 229.3 years. In the time domain, the side bands can be seen to beat against the central peak. This similar to what A2012 interpret as phase-locking. Since it is merely the time-domain counterpart to the frequency-domain signal, it does not provide any evidence for a physical connection of the signals.
Current usage metrics show cumulative count of Article Views (full-text article views including HTML views, PDF and ePub downloads, according to the available data) and Abstracts Views on Vision4Press platform.
Data correspond to usage on the plateform after 2015. The current usage metrics is available 48-96 hours after online publication and is updated daily on week days.
Initial download of the metrics may take a while.