Fig. 1
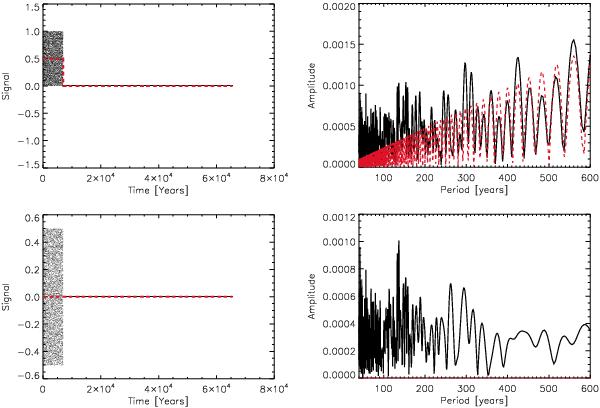
“White noise” with zero padding as defined by A2012 (upper row) and properly constructed (lower row). The left panels show the time series while the right panels give the corresponding Fourier spectra. Red dashed lines indicate the systematic component of the signal and its spectrum.
This figure is made of several images, please see below:

Current usage metrics show cumulative count of Article Views (full-text article views including HTML views, PDF and ePub downloads, according to the available data) and Abstracts Views on Vision4Press platform.
Data correspond to usage on the plateform after 2015. The current usage metrics is available 48-96 hours after online publication and is updated daily on week days.
Initial download of the metrics may take a while.