Fig. 6
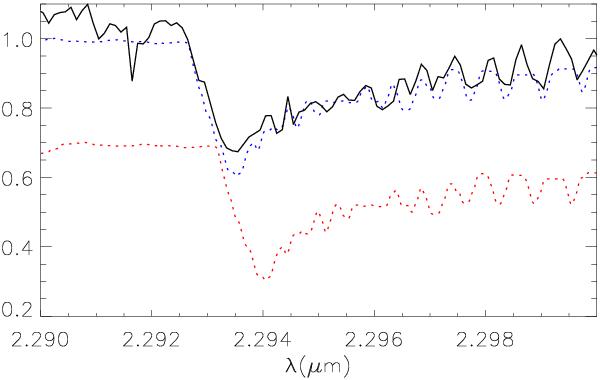
Normalized CO first overtone bandhead of CEN 34 (black solid) and those of Arcturus (red and blue dotted lines). The red-dotted line presents the rest frame spectrum of Arcturus, while the blue-dotted one is the spectrum shifted by the velocity corresponding to the result from the cross correlation with respect to CEN 34’s spectrum. The rest frame spectrum is shifted by arbitrary amounts along the vertical axis for presentation purposes.
Current usage metrics show cumulative count of Article Views (full-text article views including HTML views, PDF and ePub downloads, according to the available data) and Abstracts Views on Vision4Press platform.
Data correspond to usage on the plateform after 2015. The current usage metrics is available 48-96 hours after online publication and is updated daily on week days.
Initial download of the metrics may take a while.