Fig. 7
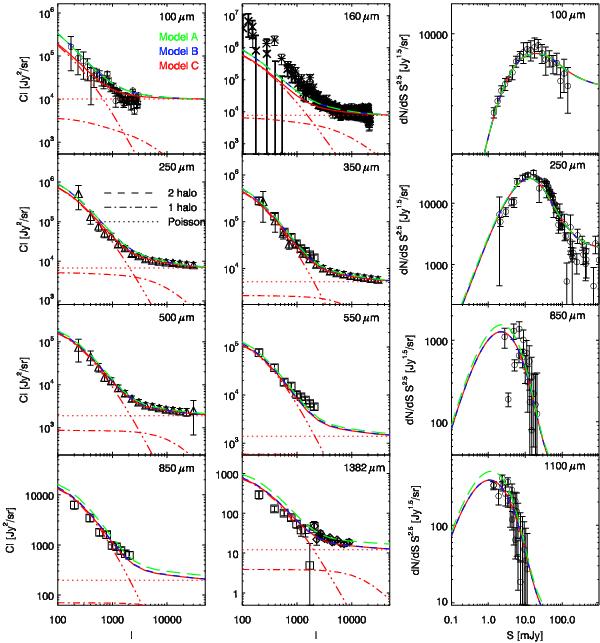
Left and center panels: CIB power spectrum predicted by our model and comparison with IRAS (160 μm, Pénin et al. 2012b, open circles), Spitzer (100 μm, Lagache et al. 2007, crosses, Pénin et al. 2012b, asterisks), Herschel (250, 350, and 500 μm, Viero et al. 2013, triangles), Planck (350, 550, 850, and 1380 μm, Planck Collaboration 2011, squares), and SPT (1380 μm, Hall et al. 2010, diamonds) measurements. The dotted, dot-dashed, and dotted lines represent the Poisson, 1-halo, and 2-halo terms. Right panel: number counts of infrared galaxies. Data are taken from the compilation of measurements in Béthermin et al. (2011) and B12. Models A, B, and C are represented by a long green dash, a short blue dash, and a solid red line, respectively. The flux cuts used to compute the model predictions are 1 Jy at 100 μm, 100 mJy at 160 μm, 0.3 mJy at 250 μm, 350 μm, and 500 μm, 0.54 Jy at 550 μm, 0.325 Jy at 850 μm, 20 mJy at 1.38 mm.
Current usage metrics show cumulative count of Article Views (full-text article views including HTML views, PDF and ePub downloads, according to the available data) and Abstracts Views on Vision4Press platform.
Data correspond to usage on the plateform after 2015. The current usage metrics is available 48-96 hours after online publication and is updated daily on week days.
Initial download of the metrics may take a while.