Fig. 6
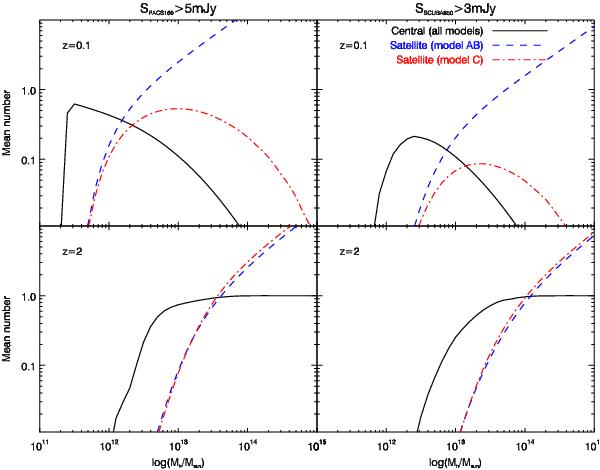
Halo occupation distribution, i.e. mean number of detected galaxies in a halo, including its substructures, as a function of its total mass Mh, of S160 > 5 mJy (left) and S850 > 3 mJy (right) sources at z = 0.1 (top) and z = 2 (bottom) for central (solid line) and satellite (dashed line) galaxies predicted by the model. The HOD of central galaxies is the same for all versions of the models and represented in black. Satellite HODs are plotted in blue (red) for model A/B (C).
Current usage metrics show cumulative count of Article Views (full-text article views including HTML views, PDF and ePub downloads, according to the available data) and Abstracts Views on Vision4Press platform.
Data correspond to usage on the plateform after 2015. The current usage metrics is available 48-96 hours after online publication and is updated daily on week days.
Initial download of the metrics may take a while.