Fig. 5
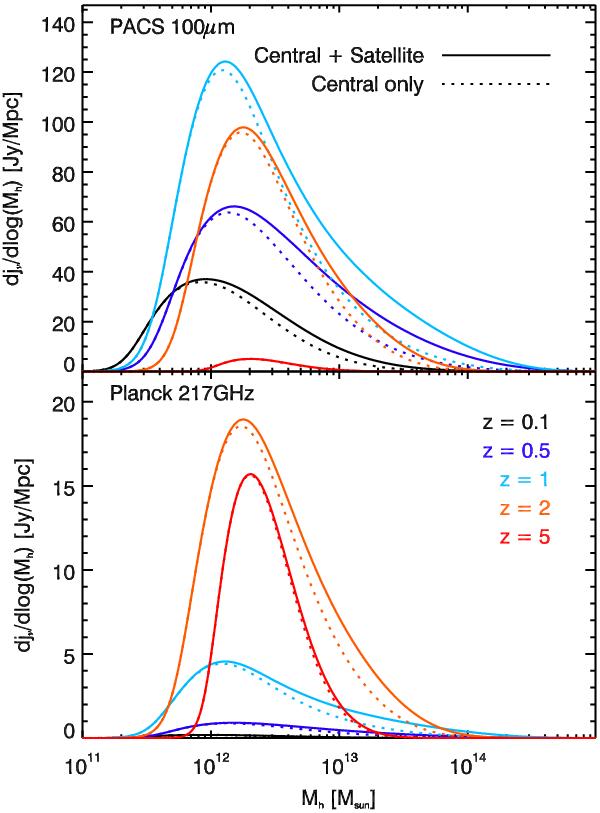
Differential emissivities at 100 μm (3000 GHz) and 1.38 mm (217 GHz) as a function of halo mass at various redshifts predicted by model C. The solid lines are the contributions of all the galaxies to the infrared flux of a main halo, when the dotted lines indicate only the contribution of central galaxies.
Current usage metrics show cumulative count of Article Views (full-text article views including HTML views, PDF and ePub downloads, according to the available data) and Abstracts Views on Vision4Press platform.
Data correspond to usage on the plateform after 2015. The current usage metrics is available 48-96 hours after online publication and is updated daily on week days.
Initial download of the metrics may take a while.