Fig. 3
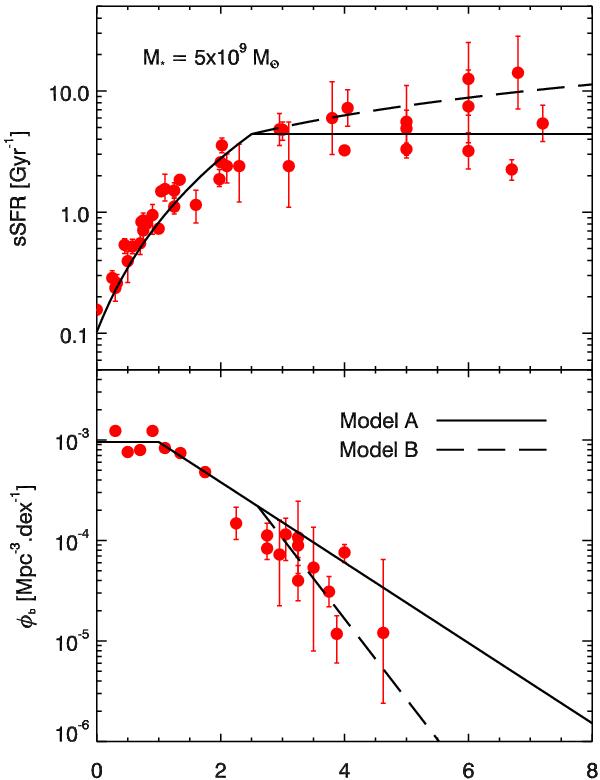
Upper panel: evolution of sSFR in main-sequence galaxies of 5 × 10⁹ M⊙. Lower panel: evolution of the characteristic density φb of the mass function with redshift. Both panels: model A (B12 model) is represented with a solid line and model B (modified version with higher sSFR and lower density at high redshift) with a long-dashed line. We use the compilation of data points of Sargent et al. (2012).
Current usage metrics show cumulative count of Article Views (full-text article views including HTML views, PDF and ePub downloads, according to the available data) and Abstracts Views on Vision4Press platform.
Data correspond to usage on the plateform after 2015. The current usage metrics is available 48-96 hours after online publication and is updated daily on week days.
Initial download of the metrics may take a while.