Fig. 15
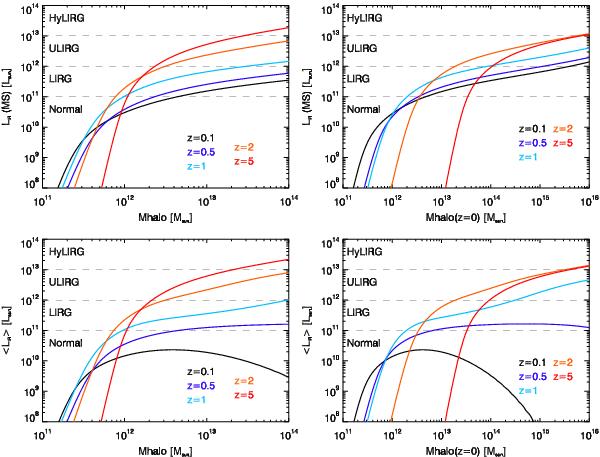
Relation between infrared luminosity of galaxies and their halo mass. The top panels correspond to the infrared luminosity for a central galaxy exactly on the main sequence. The bottom panels shows the mean infrared luminosity of the central galaxies. The left panels show results as the instantaneous halo mass and right panel as a function of halo mass at z = 0. The dashed lines correspond to the limit between normal galaxies (i.e. < 1011 L⊙), LIRGs (1011 < LIR < 1012 L⊙), ULIRGs (1012 < LIR < 1013 L⊙), and HyLIRGs (<1013 L⊙).
Current usage metrics show cumulative count of Article Views (full-text article views including HTML views, PDF and ePub downloads, according to the available data) and Abstracts Views on Vision4Press platform.
Data correspond to usage on the plateform after 2015. The current usage metrics is available 48-96 hours after online publication and is updated daily on week days.
Initial download of the metrics may take a while.