Fig. 12
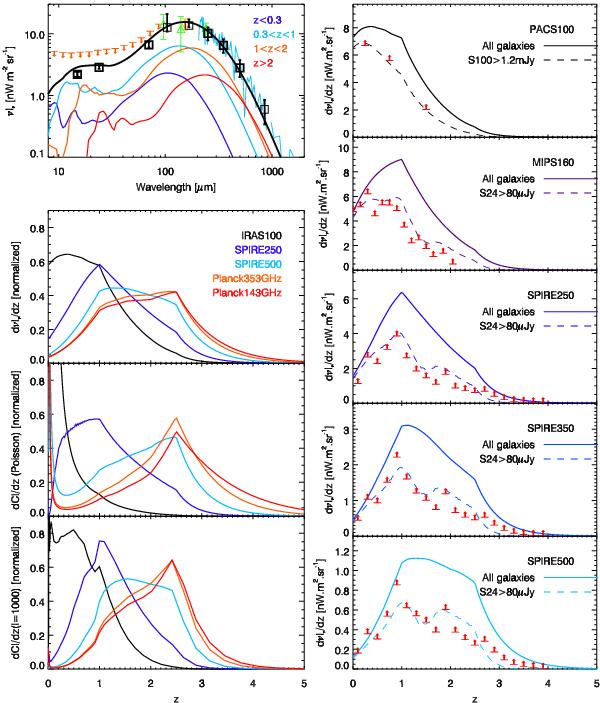
Predicted redshift distribution of the CIB and its anisotropies. Upper left panel: CIB SED and contribution per redshift slice (colored solid lines). Black squares: total extrapolated CIB from deep number counts (Teplitz et al. 2011; Béthermin et al. 2010a; Berta et al. 2011; Béthermin et al. 2012c; Zemcov et al. 2010). Cyan solid line: absolute CIB spectrum measured by COBE/FIRAS (Lagache et al. 2000). Green triangles: absolute CIB measurements performed by COBE/DIRBE at 100 μm, 140 μm, and 240 μm (updated in Dole et al. 2006). Yellow diamond: absolute measurements of Pénin et al. (2012a) at 160 μm with Spitzer/MIPS. Orange arrows: upper limits derived from opacity of the Universe to TeV photons (Mazin & Raue 2007). Lower left panel: normalized redshift distribution of the mean level (up), Poisson anisotropies (middle), large scale anisotropies at ℓ = 1000 (bottom). Various colors correspond to various bands. Right panel: contribution of various redshifts to the CIB (solid line) and comparison with lower limits derived by stacking from Berta et al. (2011) at 100 μm, Jauzac et al. (2011) at 160 μm and Béthermin et al. (2012c) at 250 μm, 350 μm, and 500 μm (arrows). The dashed lines are the model predictions taking the selection used to derive the lower limits into account. The flux density cuts are the same as previously (see Sect. 6 and Fig. 7).
Current usage metrics show cumulative count of Article Views (full-text article views including HTML views, PDF and ePub downloads, according to the available data) and Abstracts Views on Vision4Press platform.
Data correspond to usage on the plateform after 2015. The current usage metrics is available 48-96 hours after online publication and is updated daily on week days.
Initial download of the metrics may take a while.