Fig. 11
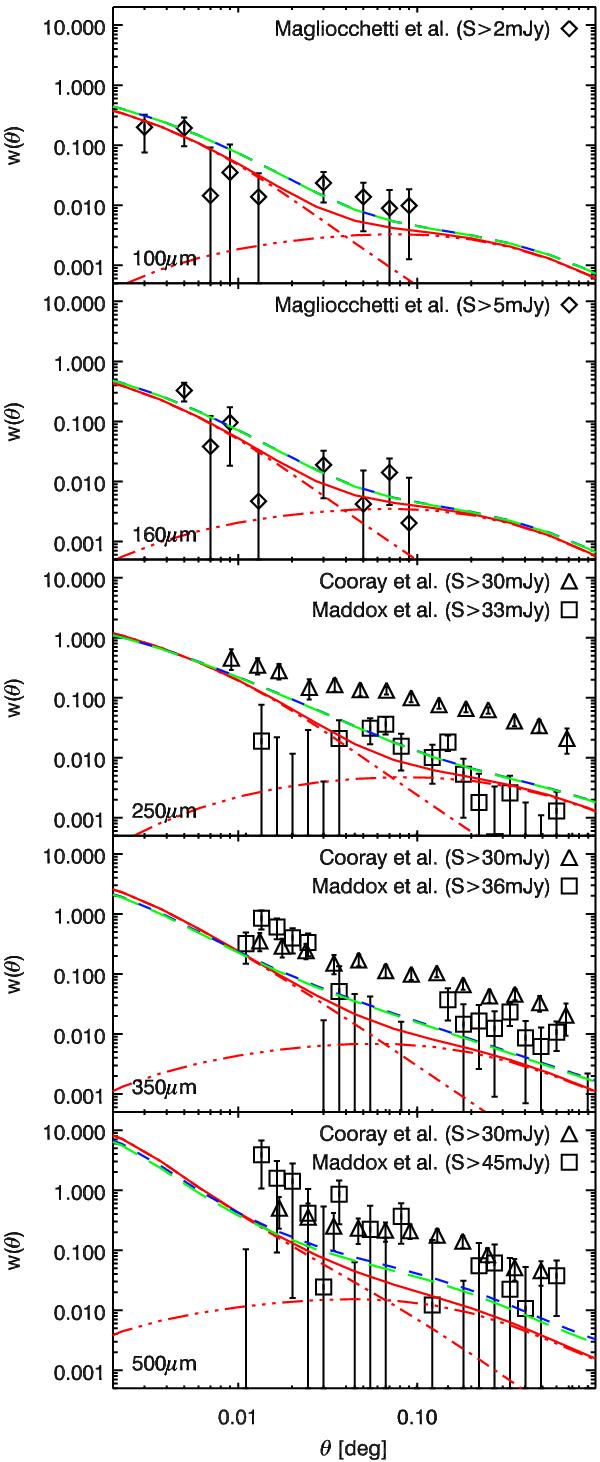
Auto-correlation function of various flux-selected sample of infrared galaxies and comparison with our model (same color coding as in Fig. 7). The data come from Magliocchetti et al. (2011) at 100 μm and 160 μm and Cooray et al. (2010) and Maddox et al. (2010) at 250, 350, and 500 μm. We used the same flux cuts as Magliocchetti et al. (2011) and Cooray et al. (2010). Models A, B, and C are represented by a long green dash, a short blue dash, and a solid red line, respectively.
Current usage metrics show cumulative count of Article Views (full-text article views including HTML views, PDF and ePub downloads, according to the available data) and Abstracts Views on Vision4Press platform.
Data correspond to usage on the plateform after 2015. The current usage metrics is available 48-96 hours after online publication and is updated daily on week days.
Initial download of the metrics may take a while.