Fig. 1
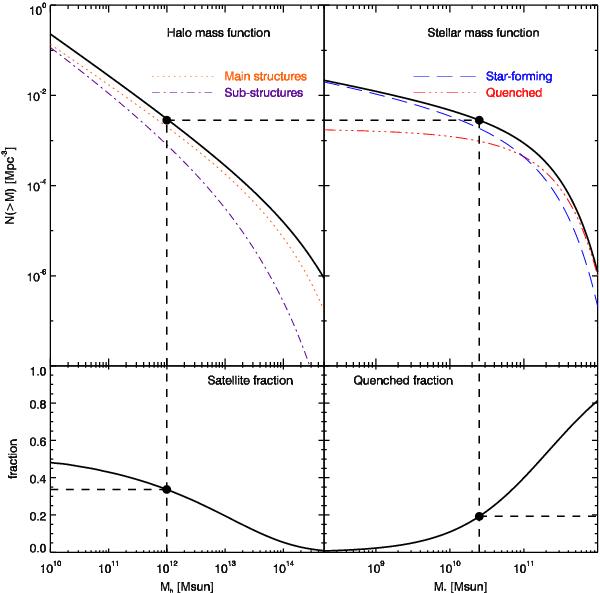
Illustration of the method used to connect various quantities by abundance matching as described in Sect. 3.3. The dashed line illustrates the connection between various quantities. We arbitrarily chose to plot results at z = 0.5. Upper left panel: integral HMF and contribution of main halos (dotted orange line) and subhalos (dot-dashed purple line). Upper right panel: integral SMF and contribution of star-forming (long-dashed blue line) and quenched (three-dot-dashed red line). Lower left panel: variation with halo mass of the fraction of halos that are subhalos. Lower right panel: fraction of quenched galaxies as a function of stellar mass.
Current usage metrics show cumulative count of Article Views (full-text article views including HTML views, PDF and ePub downloads, according to the available data) and Abstracts Views on Vision4Press platform.
Data correspond to usage on the plateform after 2015. The current usage metrics is available 48-96 hours after online publication and is updated daily on week days.
Initial download of the metrics may take a while.