Fig. 5
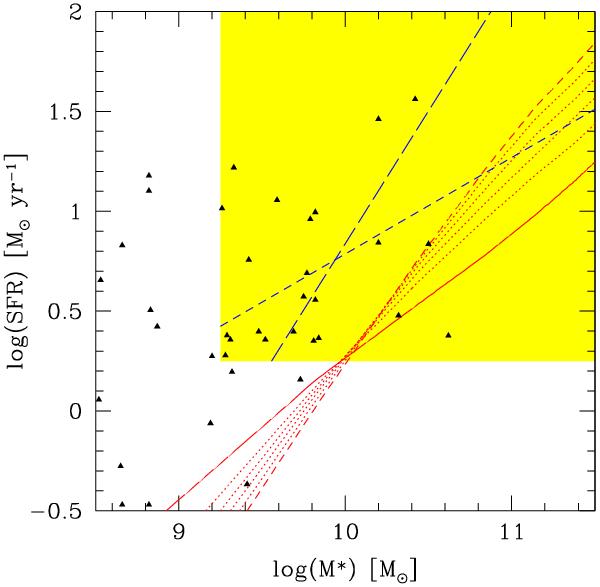
Stellar mass-SFR relation of LGRB hosts (symbols) compared to that taken from the models of Boissier et al. (2010) for SFGs shown as a set of curves (solid at redshift 0, dashed at redshift 1.1, dotted for intermediate redshifts). The shaded area corresponds to our completeness limits. The dashed lines within this area are the two regression lines (for the SFR as a function of the stellar mass and the stellar mass as a function of the SFR) computed from the LGRB hosts data.
Current usage metrics show cumulative count of Article Views (full-text article views including HTML views, PDF and ePub downloads, according to the available data) and Abstracts Views on Vision4Press platform.
Data correspond to usage on the plateform after 2015. The current usage metrics is available 48-96 hours after online publication and is updated daily on week days.
Initial download of the metrics may take a while.