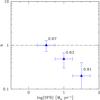
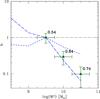
Fig. 3

Variation of the bias b with the stellar mass (bottom) and the SFR (top) with an arbitrary normalisation. The triangles show our results after interpolating the SFGs properties at the median redshift of the bin (indicated next to each symbols). In the bottom panel, the dashed lines indicate the results adopting the two regression lines of the stellar mass-SFR relation found in host galaxies (shown in Fig. 5) as explained in Sect. 5. The vertical error-bars indicates the statistical uncertainty on the number of LGRBs ( in each bin). The horizontal error-bar only indicates the width of the bin.
Current usage metrics show cumulative count of Article Views (full-text article views including HTML views, PDF and ePub downloads, according to the available data) and Abstracts Views on Vision4Press platform.
Data correspond to usage on the plateform after 2015. The current usage metrics is available 48-96 hours after online publication and is updated daily on week days.
Initial download of the metrics may take a while.