Fig. 2
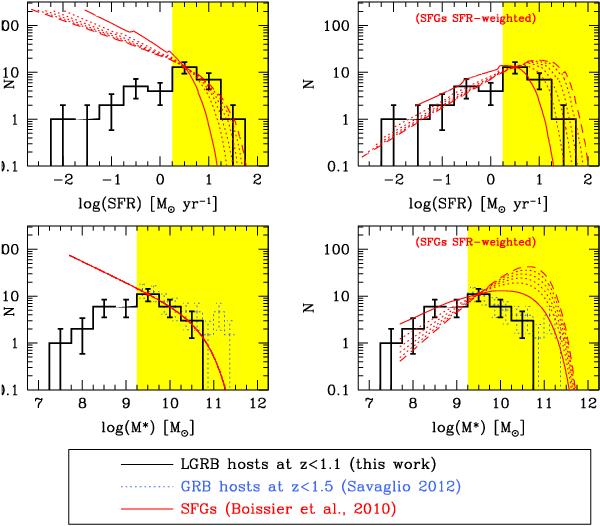
Histograms of the stellar mass function (bottom) and SFR distribution (top) of the LGRB host galaxies. The shaded area indicates the region where we expect to be complete. Outside of this region, our results are likely to underestimate the number of host galaxies. In the bottom panels, the dotted histogram reports the stellar mass function of LGRB hosts by Savaglio (2012) as a comparison. In left panels, the LGRB host distributions are compared with those of star-forming galaxies as modelled in Boissier et al. (2010). Solid and dashed curve refers to redshift 0 and 1.1, respectively, while dotted lines are for intermediate redshifts (0.3, 0.5, 0.7, and 0.9). As the LGRB rate is proportional to the SFR (for constant b), a direct comparison between LGRB host and SFG distributions is not possible. Right panels show the same comparison when SFG distributions are weighted by the SFR. In this case, the LGRB host and SFG distribution should be identical for a constant bias b.
Current usage metrics show cumulative count of Article Views (full-text article views including HTML views, PDF and ePub downloads, according to the available data) and Abstracts Views on Vision4Press platform.
Data correspond to usage on the plateform after 2015. The current usage metrics is available 48-96 hours after online publication and is updated daily on week days.
Initial download of the metrics may take a while.