Fig. 1
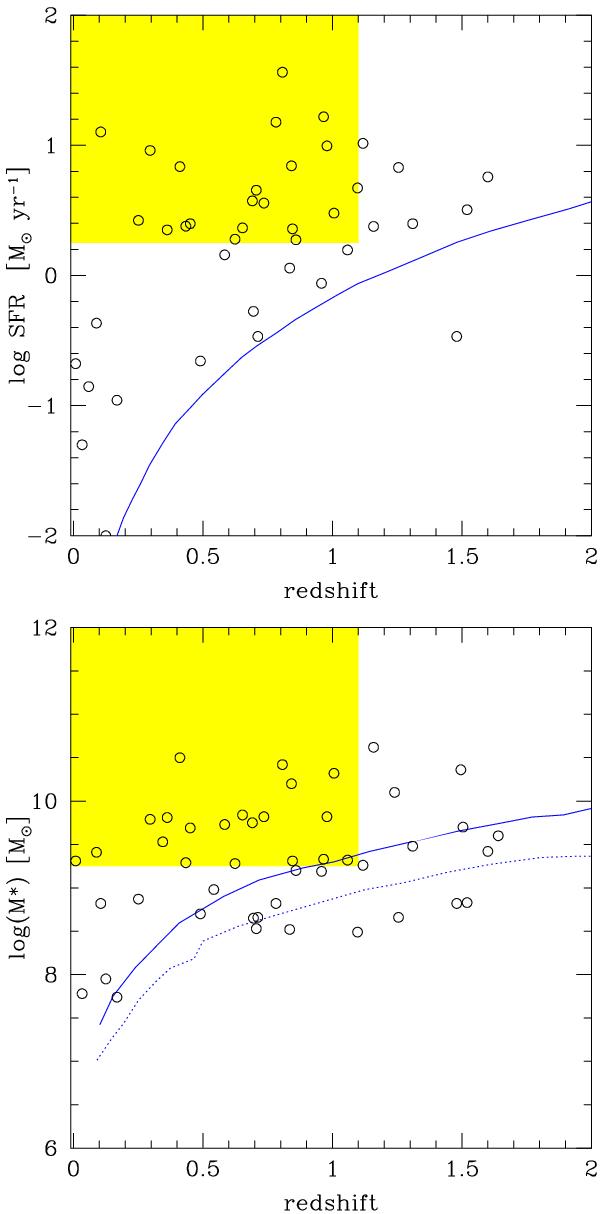
Galaxy stellar mass (bottom) and SFR (top) for LGRB host galaxies considered in this paper. The lines indicate the limits shown in the figures of Savaglio et al. (2009): The solid and dashed lines in the bottom panel show the stellar mass as a function of redshift of a galaxy with a K-band magnitude of 24.3 and either an old stellar population or constant SFR, respectively. In the top panel, the line represents an Hα or [O II] emission flux of 1.3 × 10⁻¹⁷ erg s-1 or 0.7 × 10⁻¹⁷ erg s-1, respectively, assuming a dust extinction in the visual band A(V) = 0.53. The shaded area indicates our selection criteria: We work at redshift lower than 1.1 and above a minimal value for the stellar masses and SFR, so that our sample is complete.
Current usage metrics show cumulative count of Article Views (full-text article views including HTML views, PDF and ePub downloads, according to the available data) and Abstracts Views on Vision4Press platform.
Data correspond to usage on the plateform after 2015. The current usage metrics is available 48-96 hours after online publication and is updated daily on week days.
Initial download of the metrics may take a while.