Free Access
Fig. 2
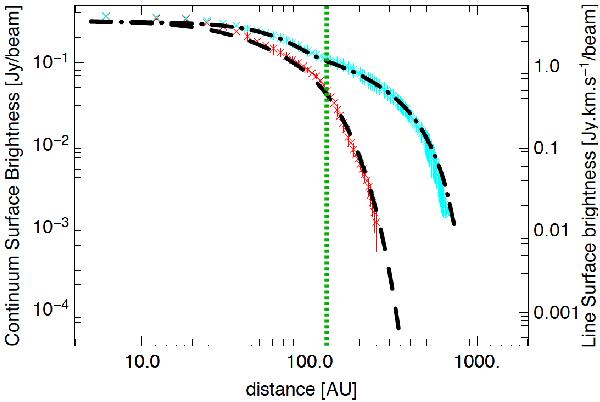
Surface brightness profiles for the continuum (red crosses) and for the CO(3–2) (light blue crosses) with 1σ error bars. Dashed and dash-dotted lines represent two different model fits required for the continuum (with γ = 0.1) and for the spectral line (γ = 0.9) profiles respectively. Green dotted line marks Rc = 125 AU.
Current usage metrics show cumulative count of Article Views (full-text article views including HTML views, PDF and ePub downloads, according to the available data) and Abstracts Views on Vision4Press platform.
Data correspond to usage on the plateform after 2015. The current usage metrics is available 48-96 hours after online publication and is updated daily on week days.
Initial download of the metrics may take a while.