Fig. 9
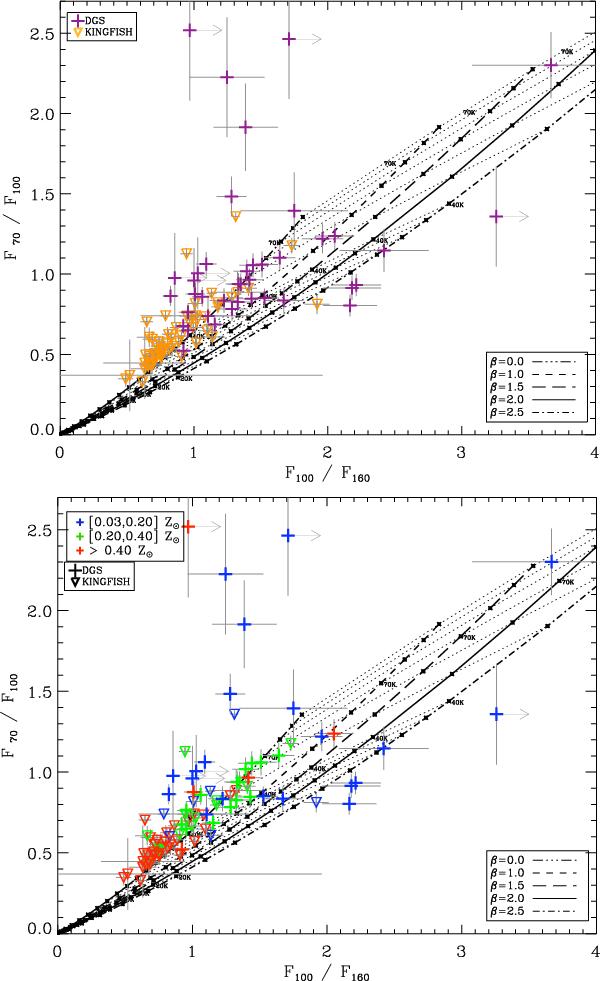
Colour−colour diagram: PACS/PACS diagram: F70/F100 versus F100/F160. Top: the colour and symbol code differentiates DGS (purple crosses) and KINGFISH galaxies (orange downward triangles). Bottom: the colour code delineates the different metallicity bins this time. Crosses and downward triangles are still representing DGS and KINGFISH galaxies, respectively. For both plots, the curves give theoretical Herschel flux ratios for simulated modified black bodies for βtheo = 0.0 to 2.5 and T from 0 to 40 K in 2 K bins and from 40 to 100 K in 10 K bins, as black dots, increasing in T from left to right. Lines of constant T are indicated as dotted lines, and a few temperatures have been marked on the plots.
Current usage metrics show cumulative count of Article Views (full-text article views including HTML views, PDF and ePub downloads, according to the available data) and Abstracts Views on Vision4Press platform.
Data correspond to usage on the plateform after 2015. The current usage metrics is available 48-96 hours after online publication and is updated daily on week days.
Initial download of the metrics may take a while.