Fig. 6
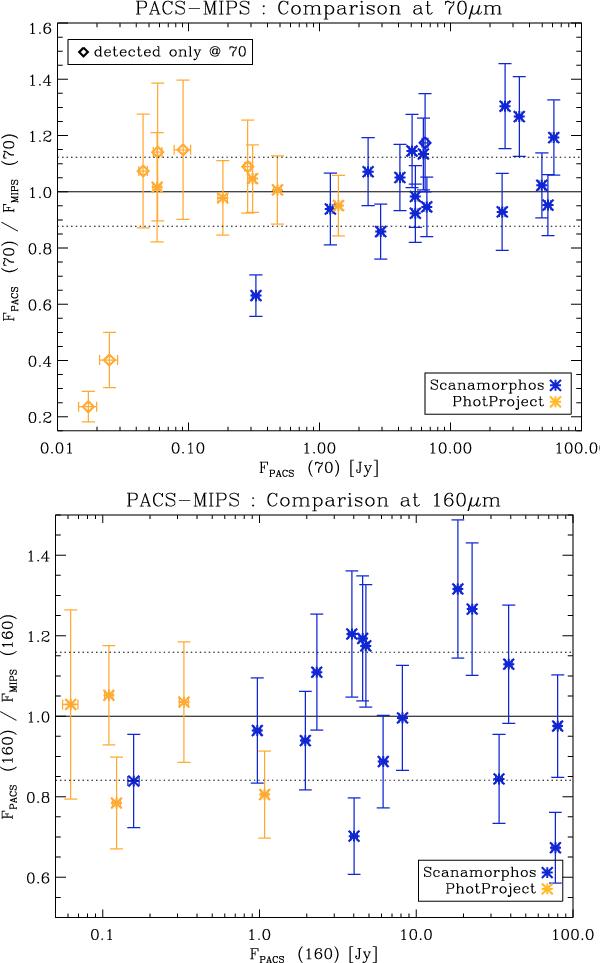
Comparison of PACS flux densities and MIPS flux densities: PACS-to-MIPS flux density ratios as a function of PACS flux density at 70 μm (top) and 160 μm (bottom). As a guide to the eye, the unity line is added as a solid line as well as the average uncertainties on the ratio in both bands as dotted lines. These average uncertainties are ~12% and ~16% at 70 and 160 μm. Colours distinguish the selected mapping method.
Current usage metrics show cumulative count of Article Views (full-text article views including HTML views, PDF and ePub downloads, according to the available data) and Abstracts Views on Vision4Press platform.
Data correspond to usage on the plateform after 2015. The current usage metrics is available 48-96 hours after online publication and is updated daily on week days.
Initial download of the metrics may take a while.