Fig. A.1
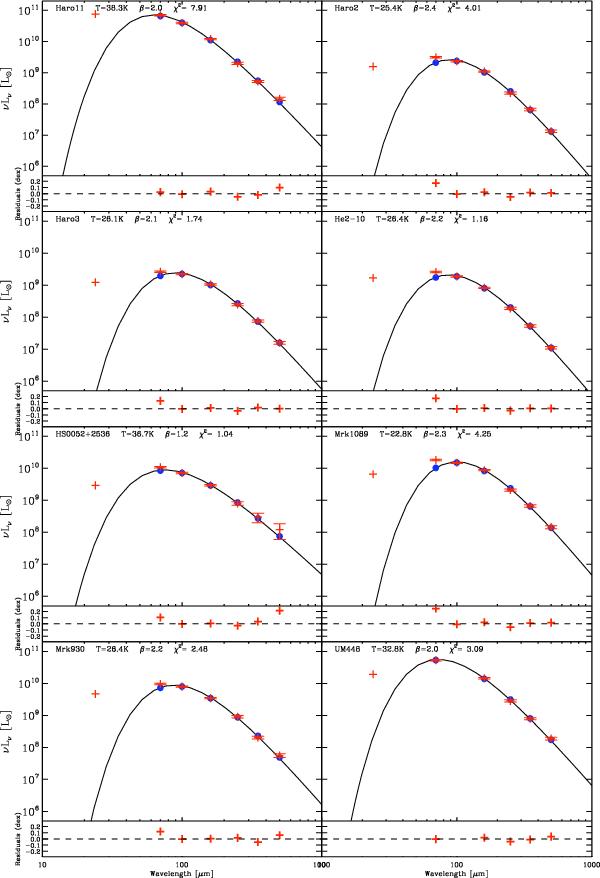
Modified blackbody fits of the 70 to 500 μm range for the DGS. The solid black line is the modelled modified blackbody, the blue circles are the modelled points. The red symbols are the observations: crosses are for detections and diamonds are for upper limits. We overlay the MIPS 24 μm point from Bendo et al. (2012). The T and β parameters are indicated on the top of each plot along with the χ2 value of the fit. The bottom panel of each plot indicates the residuals from the fit.
Current usage metrics show cumulative count of Article Views (full-text article views including HTML views, PDF and ePub downloads, according to the available data) and Abstracts Views on Vision4Press platform.
Data correspond to usage on the plateform after 2015. The current usage metrics is available 48-96 hours after online publication and is updated daily on week days.
Initial download of the metrics may take a while.