Fig. 14
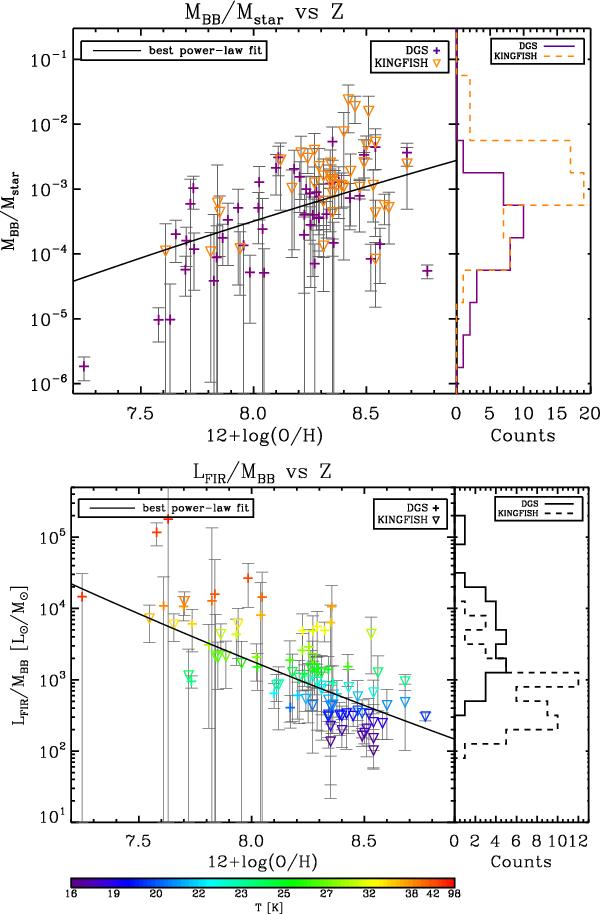
Top: MBB/Mstar as a function of metallicity for DGS (purple crosses) and KINGFISH (orange downward triangles). The best power-law fit is indicated as a black line, and corresponds to: log (MBB/Mstar) = (−21.8 ± 1.5) + (20.3 ± 1.6) × log (12 + log (O/H)). The distribution of MBB/Mstar is indicated on the side for both samples: plain purple line for DGS and dashed orange line for KINGFISH. Bottom: LFIR/MBB as a function of metallicity for DGS (crosses) and KINGFISH (downward triangles). The colours code the temperature, T. The best power-law fit line is indicated as a black line, and corresponds to: log (LFIR/MBB) = (24.4 ± 1.1) + (−23.6 ± 1.2) × log (12 + log (O/H)). The distribution of LFIR/MBB is indicated on the side for both samples: plain line for DGS and dashed line for KINGFISH. On both plots: the errors on the metallicities are omitted for clarity. They are of about 0.1 dex on average.
Current usage metrics show cumulative count of Article Views (full-text article views including HTML views, PDF and ePub downloads, according to the available data) and Abstracts Views on Vision4Press platform.
Data correspond to usage on the plateform after 2015. The current usage metrics is available 48-96 hours after online publication and is updated daily on week days.
Initial download of the metrics may take a while.