Fig. 10
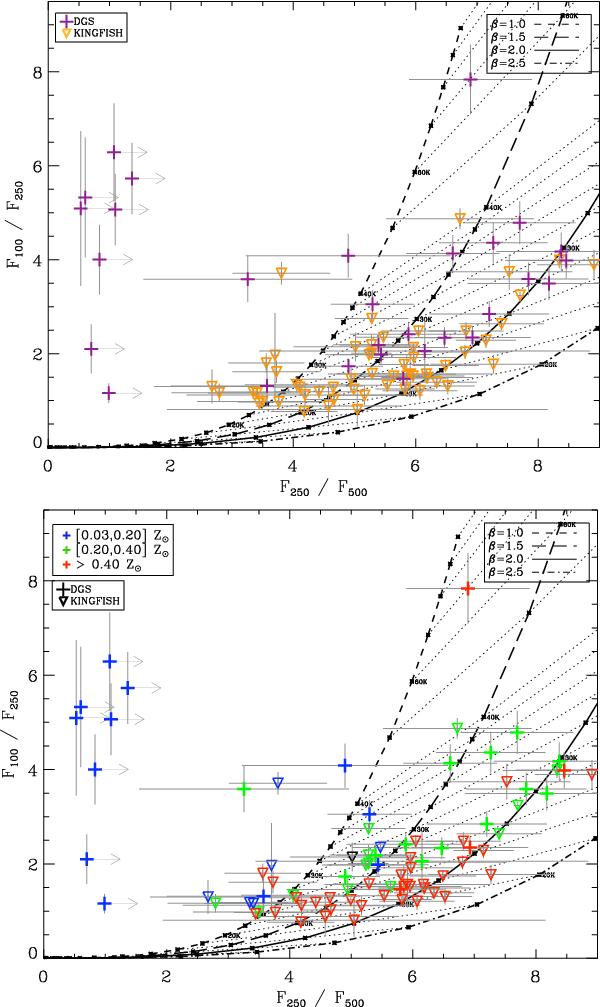
Colour−colour diagram: PACS/SPIRE diagram: F100/F250 versus F250/F500. The colour and symbol choices are the same as in Fig. 9 for both figures. Note that the most metal-poor galaxies (from 0.03 to 0.20 Z⊙) are very faint and even not detected anymore at long wavelengths. We were only able to derive upper limits beyond 160 μm for these galaxies and, thus, some galaxies do not appear on this diagram anymore.
Current usage metrics show cumulative count of Article Views (full-text article views including HTML views, PDF and ePub downloads, according to the available data) and Abstracts Views on Vision4Press platform.
Data correspond to usage on the plateform after 2015. The current usage metrics is available 48-96 hours after online publication and is updated daily on week days.
Initial download of the metrics may take a while.