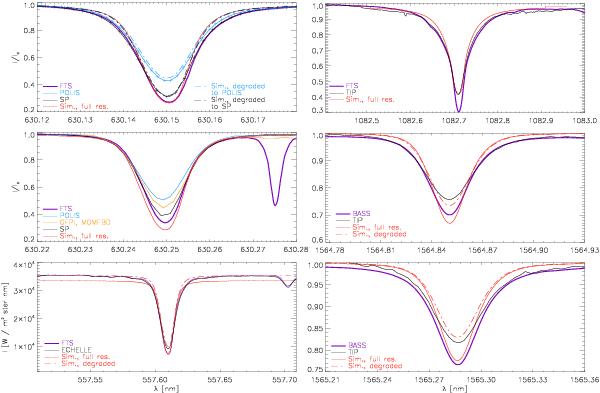
Fig. 8

Spatially averaged profiles of the 630 nm range (left top two rows), the 557 nm range (bottom left), and the near-IR wavelength ranges (right column). For the 630.15 nm line, the spectral sampling of the SP and POLIS is indicated by crosses. The thick purple curves show the spectra in the FTS or BASS atlas, depending on the wavelength range of interest. For 557.6 nm, 630.15 nm, 1564.8 nm and 1565.2 nm the profiles from the HD-SPAT-SPEC are over-plotted with dash-dotted lines. In the plot at 557.6 nm, absolute flux units are used and the normalization of the HD-FR spectra to the FTS was undone.
Current usage metrics show cumulative count of Article Views (full-text article views including HTML views, PDF and ePub downloads, according to the available data) and Abstracts Views on Vision4Press platform.
Data correspond to usage on the plateform after 2015. The current usage metrics is available 48-96 hours after online publication and is updated daily on week days.
Initial download of the metrics may take a while.


