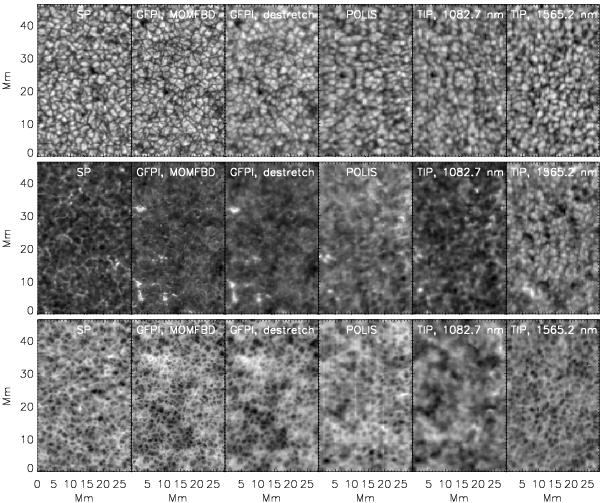
Fig. 2

Overview maps representative of the different observational data sets. Top to bottom: continuum intensity Ic, line-core intensity Icore and line-core velocity vcore. Left to right: SP, GFPI (MOMFBD), GPFI (destretched), POLIS, TIP@1083 nm, and TIP@1565 nm. Black/white in the velocity maps denotes motions towards/away from the observer. All images are scaled individually inside their full dynamical range.
Current usage metrics show cumulative count of Article Views (full-text article views including HTML views, PDF and ePub downloads, according to the available data) and Abstracts Views on Vision4Press platform.
Data correspond to usage on the plateform after 2015. The current usage metrics is available 48-96 hours after online publication and is updated daily on week days.
Initial download of the metrics may take a while.


