Fig. 1
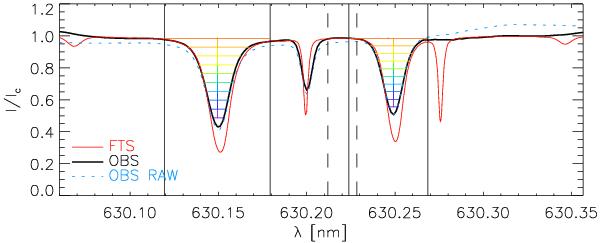
Example spectrum at 630 nm from POLIS. Blue-dotted line: average spectrum without correction for intensity gradients over the wavelength range. Black line: corrected spectrum. Red line: FTS atlas spectrum. The dashed vertical lines denote the “continuum” range, the solid vertical lines the range that was considered for determining the line parameters of Fe i 630.15 nm and Fe i 630.25 nm, respectively. The coloured horizontal lines inside the absorption profiles illustrate the method used to determine line properties at different line depression levels.
Current usage metrics show cumulative count of Article Views (full-text article views including HTML views, PDF and ePub downloads, according to the available data) and Abstracts Views on Vision4Press platform.
Data correspond to usage on the plateform after 2015. The current usage metrics is available 48-96 hours after online publication and is updated daily on week days.
Initial download of the metrics may take a while.