Fig. 9
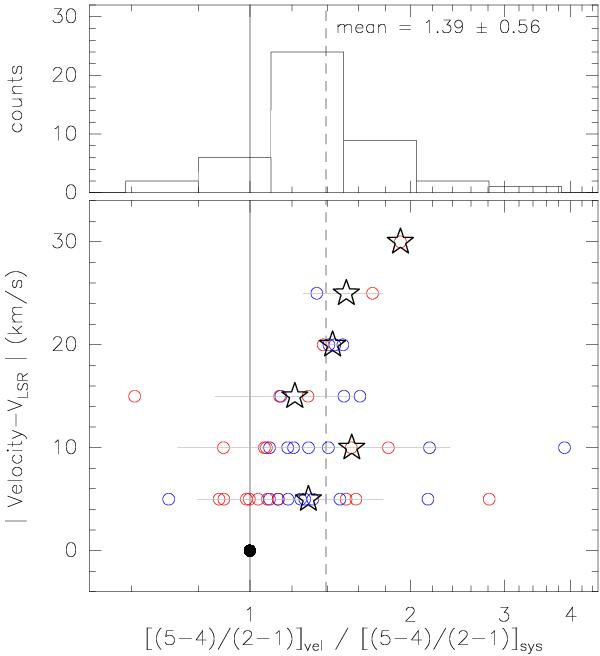
Bottom panel: velocity, with respect to the systemic velocity, against the SiO (5−4)/(2−1) line ratio, normalized with the line ratio measured at systemic velocities. The black dot corresponds to the normalized line ratio equal to unity that corresponds to the systemic velocity. Red and blue circles correspond to the red and blue-shifted SiO emission. Stars (and horizontal gray lines) indicate the mean (and dispersion) value at each velocity. The vertical dashed line indicates the mean value for all the line ratios at velocities higher than the systemic velocity. Top panel: distribution of normalized SiO (5−4)/(2−1) line ratios. The mean (and dispersion) value, corresponding to 1.39 (0.56), is indicated with the vertical dashed line.
Current usage metrics show cumulative count of Article Views (full-text article views including HTML views, PDF and ePub downloads, according to the available data) and Abstracts Views on Vision4Press platform.
Data correspond to usage on the plateform after 2015. The current usage metrics is available 48-96 hours after online publication and is updated daily on week days.
Initial download of the metrics may take a while.