Fig. 7
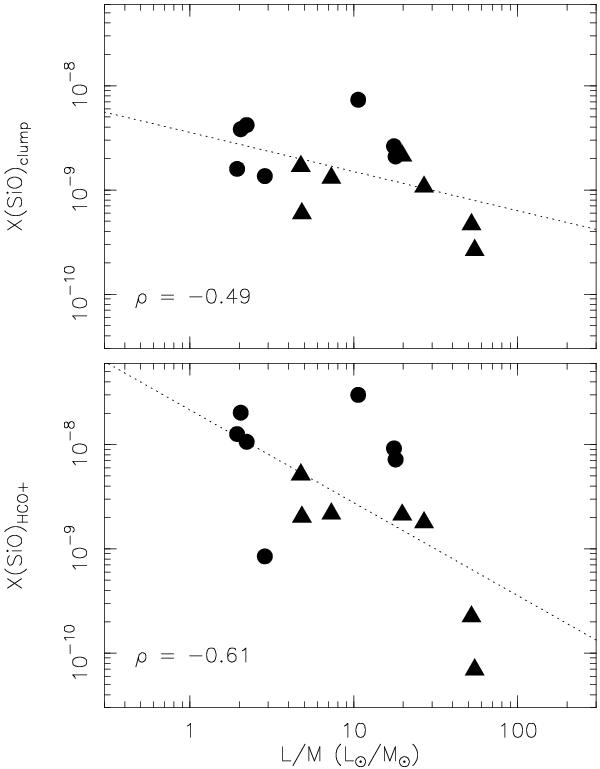
SiO abundance determined from the gas mass of the clump (top panel) and from the SiO to HCO+ column density ratio (bottom panel) versus L/M. Symbols are the same as in Fig. 5. The black dotted lines show the result of least squares fits to the data, with the Pearson correlation coefficient (ρ) shown in the bottom left corner.
Current usage metrics show cumulative count of Article Views (full-text article views including HTML views, PDF and ePub downloads, according to the available data) and Abstracts Views on Vision4Press platform.
Data correspond to usage on the plateform after 2015. The current usage metrics is available 48-96 hours after online publication and is updated daily on week days.
Initial download of the metrics may take a while.