Fig. 3
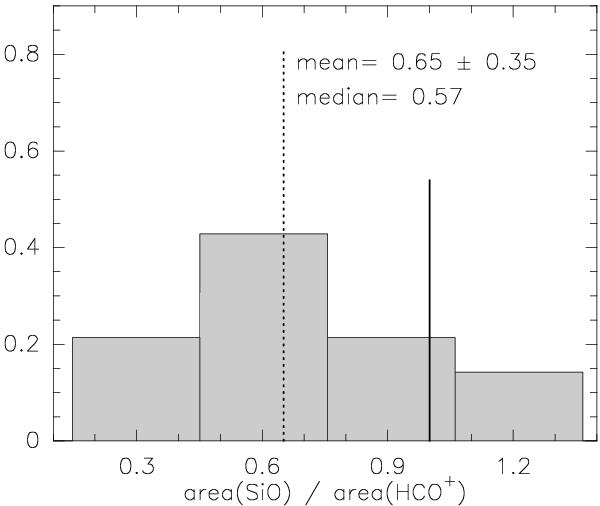
Distribution of the SiO (2−1) to HCO+ (1−0) area ratio for the outflow emission. The solid vertical line corresponds to the equality (i.e., equal sizes for the SiO and HCO+ outflow lobes). The dotted vertical line marks the mean value of the distribution. The mean (± standard deviation) and median values are shown in the panel. The total number of sources is 14.
Current usage metrics show cumulative count of Article Views (full-text article views including HTML views, PDF and ePub downloads, according to the available data) and Abstracts Views on Vision4Press platform.
Data correspond to usage on the plateform after 2015. The current usage metrics is available 48-96 hours after online publication and is updated daily on week days.
Initial download of the metrics may take a while.