Fig. 10
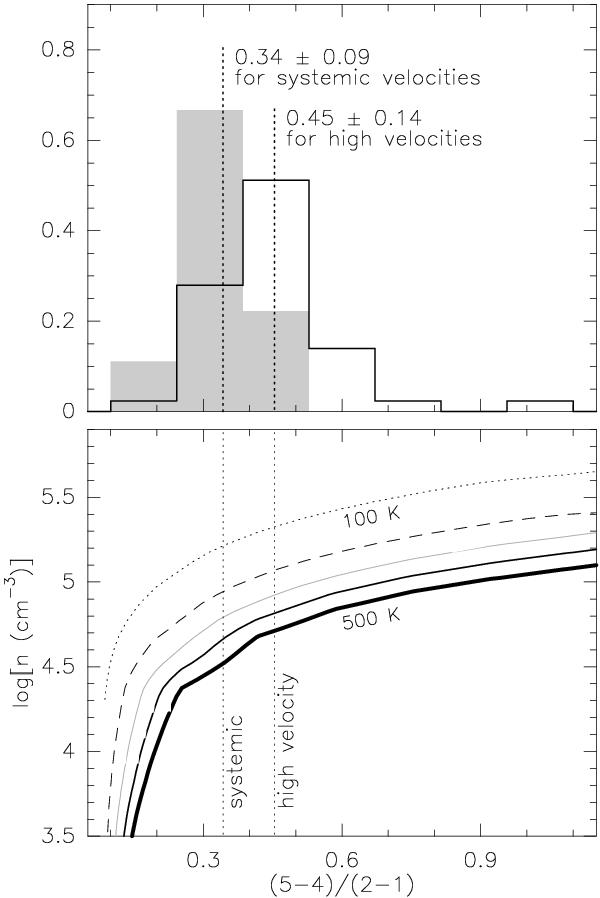
Top panel: distributions of the SiO (5−4)/(2−1) ratio for two different velocity regimes: systemic velocities (gray filled histogram) and high velocities (solid line histogram). The dotted line and numbers indicate the mean (±standard deviation) value. Bottom panel: LVG results produced by the RADEX code. We plot the density versus the SiO (5−4)/(2−1) ratio. The curves correspond to kinetic temperatures ranging from 100 K (upper curve) to 500 K (lower curve) in steps of 100 K. The two vertical lines correspond to the mean (5−4)/(2−1) ratios for systemic and high velocities.
Current usage metrics show cumulative count of Article Views (full-text article views including HTML views, PDF and ePub downloads, according to the available data) and Abstracts Views on Vision4Press platform.
Data correspond to usage on the plateform after 2015. The current usage metrics is available 48-96 hours after online publication and is updated daily on week days.
Initial download of the metrics may take a while.