Fig. 7
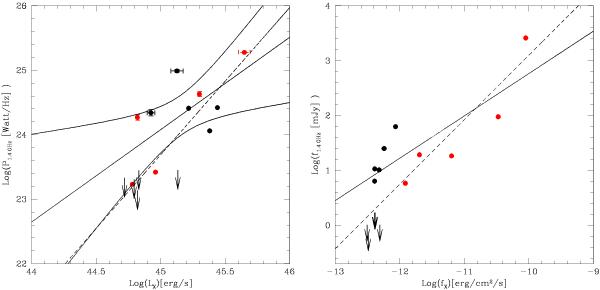
Left: the P1.4 GHz − LX plane for mini-halos. The black arrows are the upper limits on the detection of mini-halos (see Sect. 5.1). The black filled circles are mini-halos detected in the GRHS sample. Red points are other mini-halos from the literature (Feretti et al. 2012). The black, solid straight line is the best fit obtained for a possible scaling between the radio-power and X-ray luminosity using only detected mini-halos. The black curved lines encompass the 95% confidence region (i.e. the region that has a 95% probability of containing the regression line). The dashed line is a best fit also including the upper limits. Right: the distribution of the same mini-halos and upper limits in the radio versus X-ray flux plane. The solid line has a slope 0.77 ± 0.17, and the dashed line has a slope 1.17 ± 0.25.
Current usage metrics show cumulative count of Article Views (full-text article views including HTML views, PDF and ePub downloads, according to the available data) and Abstracts Views on Vision4Press platform.
Data correspond to usage on the plateform after 2015. The current usage metrics is available 48-96 hours after online publication and is updated daily on week days.
Initial download of the metrics may take a while.