Fig. 5
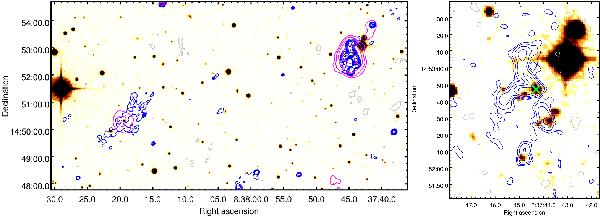
Left: the complex blend of radio galaxies is toward the right and the diffuse emission is toward left shown in contours at 610 and 235 MHz on the DSS R band image in colour. Contours at 610 MHz are 0.2 × (± 1,1.5,2,4,8,16,...) mJy beam-1. The positive contours are in blue and negative in grey. The magenta contour levels at 235 MHz are 3.0,4.0,6.0,12.0 mJy beam-1. There are no negative contours at 235 MHz in this region. The synthesized beams are 7.7′′ × 6.2′′,PA −63.6° at 610 MHz and 29.7′′ × 25.2′′,PA 35.7° at 235 MHz. Right: the complex blend of radio galaxies in the high resolution 610 MHz image. The synthesized beam is 4.3′′ × 3.2′′, PA −80.0. The contour levels are 0.15 × (± 1,2,4,8,...) mJy beam-1. The position of the galaxy cluster WHL J083744.3+145247 is marked by a “×”.
Current usage metrics show cumulative count of Article Views (full-text article views including HTML views, PDF and ePub downloads, according to the available data) and Abstracts Views on Vision4Press platform.
Data correspond to usage on the plateform after 2015. The current usage metrics is available 48-96 hours after online publication and is updated daily on week days.
Initial download of the metrics may take a while.