Fig. 4
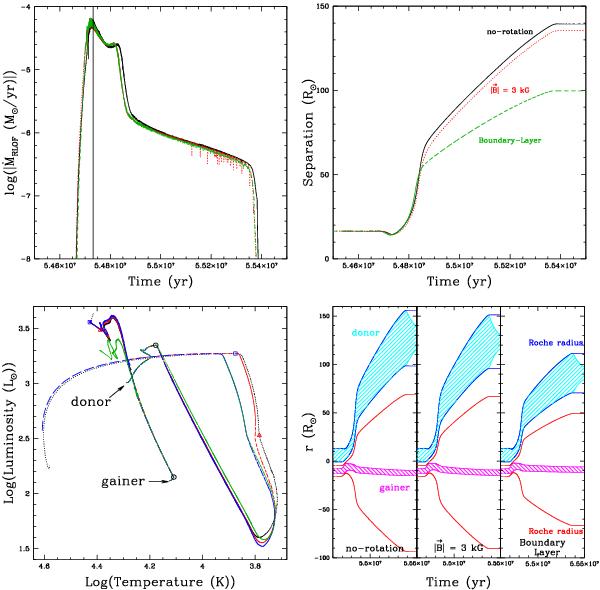
Evolution of our 6 + 3.6 M⊙ system with different braking mechanisms: (solid black line) rotation-free model; (dotted red line) magnetic field 3 kG; (dashed green line) boundary-layer treatment. Top left: mass accretion rate on the gainer. The vertical line represents the epoch when the mass ratio q = 1. Top right: orbital separation. Bottom left: HR diagram for the three configurations: (solid black) rotation-free model; (dotted red) 3 kG magnetic field; (dashed blue) boundary-layer treatment; (dot-dashed green) hotspot (see Appendix A). The open circles correspond to the beginning of mass transfer, triangles to the transition between the rapid and quiescent phase of mass transfer, and squares to the end of mass transfer (only on the rotation-free model). Bottom right: extension of the donor (top cyan hatched area) and gainer (bottom magenta hatched area) within their Roche lobes RL (donor (solid blue lines) gainer (solid red lines)) for the three cases. The y-axis represents the position relative to the system’s centre of mass. The gap between the Roche lobe radii RL of the two stars is because RL is defined as the radius of a sphere with a volume equivalent to the Roche lobe and therefore differs from the true location of the ℒ1 point.
Current usage metrics show cumulative count of Article Views (full-text article views including HTML views, PDF and ePub downloads, according to the available data) and Abstracts Views on Vision4Press platform.
Data correspond to usage on the plateform after 2015. The current usage metrics is available 48-96 hours after online publication and is updated daily on week days.
Initial download of the metrics may take a while.