Fig. 6
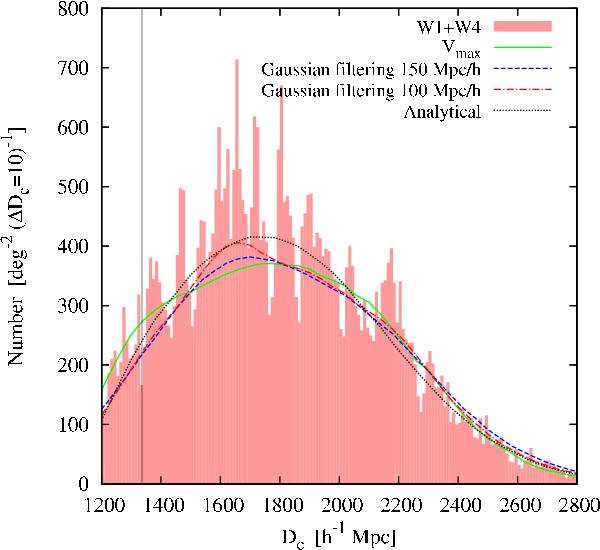
Comparison of different estimators of the radial distribution in the combined W1+W4 sample. The filled histogram shows the number of galaxies in fine bins of radial comoving distance. The different curves correspond to random radial distribution realisations normalised to the number of objects in the data, obtained using the Vmax (solid), Gaussian filtering (dashed and dot-dashed), or analytical (dotted) methods. The vertical line shows the minimum redshift considered in this analysis, i.e. z = 0.5.
Current usage metrics show cumulative count of Article Views (full-text article views including HTML views, PDF and ePub downloads, according to the available data) and Abstracts Views on Vision4Press platform.
Data correspond to usage on the plateform after 2015. The current usage metrics is available 48-96 hours after online publication and is updated daily on week days.
Initial download of the metrics may take a while.