Fig. 4
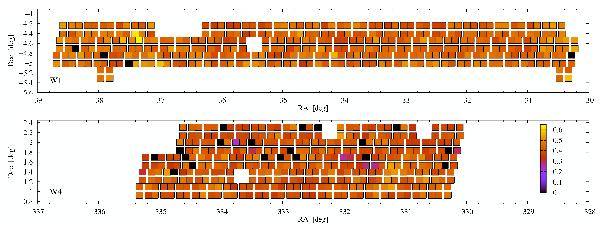
Variations of the target success rate (TSR) with quadrants. The TSR quantifies our ability of obtaining spectra from the potential targets meeting the survey selection in the parent photometric sample. The quadrants filled in black correspond to failed observations where no spectroscopy has been taken.
Current usage metrics show cumulative count of Article Views (full-text article views including HTML views, PDF and ePub downloads, according to the available data) and Abstracts Views on Vision4Press platform.
Data correspond to usage on the plateform after 2015. The current usage metrics is available 48-96 hours after online publication and is updated daily on week days.
Initial download of the metrics may take a while.